Web app · dekost.eu
Dekost
Supermarket food, ranked by protein per euro.
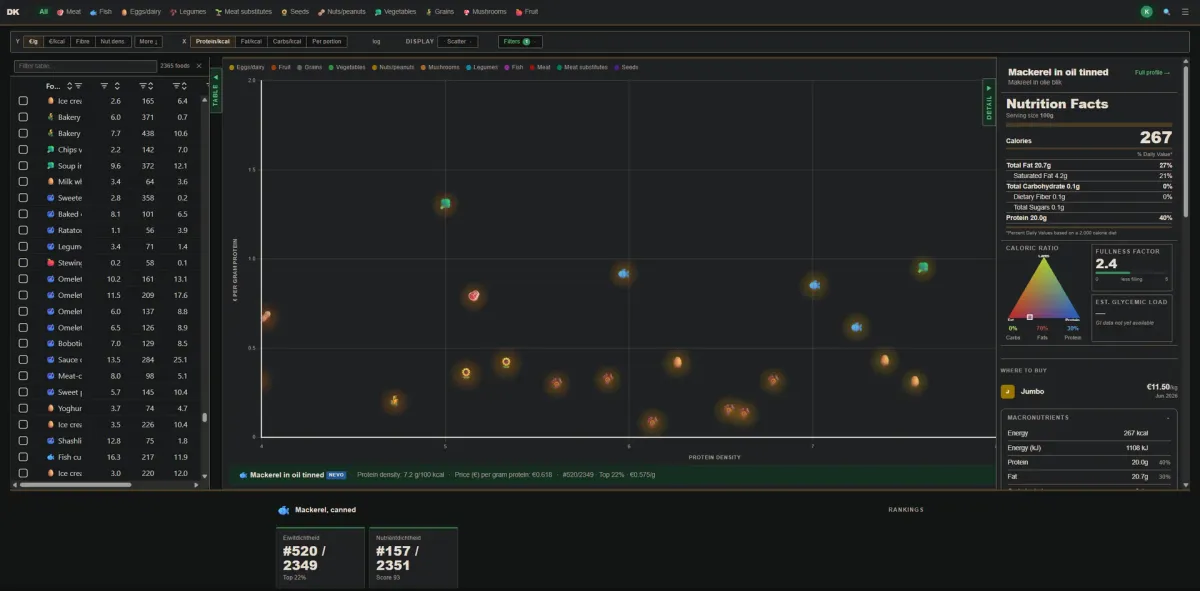
What does a gram of protein actually cost? Dekost answers that for the food in Dutch supermarkets. It ranks foods by protein per euro, and lets you filter and compare them in a table and on a chart. The nutrition data comes from the Dutch RIVM NEVO database (version 2025/9.0) and from USDA FoodData Central.
Dekost is in beta, and you see it after signing in: with Google, Facebook, Microsoft or an email address. That’s why this page shows a single picture, taken by me inside the app.
What you can do
- Filter by kind of food: meat, fish, eggs and dairy, legumes, meat substitutes, seeds, nuts, vegetables, grains, mushrooms and fruit.
- Plot the foods on a chart, by protein density against the price of a gram of protein.
- Pick a food to see its nutrition facts, how its calories split between carbohydrate, fat and protein, how filling it is, and where to buy it for what price.
- See where a food ranks among all the others.
- Sign in to keep your profile and your food diaries in step across devices.
The hard parts
Price meets nutrition. Dekost puts a supermarket price next to the nutrition data of each food, so the cost of a gram of protein can be compared across all of them.
Two databases, credited. The nutrition data comes from the Dutch NEVO tables of the RIVM and from USDA FoodData Central, and both are credited at the foot of the page.